Simon McLellan (Head of Climate Programmes for Government at the Met Office) presenting at the Fit for the Future Network Harvest conference in Oct 2018
How is this data different?
- The UKCP18 project gives updated projections of sea-level rise, greater regional detail, further analysis of the risks faced both nationally and globally, and provides more information on potential extremes and impacts of climate change.
- A range of future climate scenarios until 2100 are covered based on different rates of greenhouse gas emissions into the atmosphere. These are an update to the existing emissions scenarios used in UKCP09, which did not consider specific climate change mitigation strategies to limit emissions.
- New science used means a move from looking at the trends associated with climate change to describing how seasonal weather patterns will change. An example of this is that heatwaves like the one we experienced in the summer of 2018 could be normal for the UK by mid-century.
What does the data include?
There are five distinct sets of climate data that comprise the projections:
- Probabilistic Projections: These give future projections for variables such as rainfall or average temperature within a given area of the UK in a specific period, such as ‘average temperature in England in winter 2020’. The monthly projections also mean you can create ‘average’ weather which evolves over time.
- Global Projections: As well as covering regions outside the UK and Europe these allow us to analyse the climate at multiple geographical locations at the same time e.g. assessing climate change impacts on the rail network across the whole of the UK. The global projections allow for calculations of a larger set of metrics than that available in the probabilistic projections. They also provide large scale or historical context for regional changes.
- Regional Projections: If you are investigating local climate effects, the regional projections are down-scaled versions of the global projections at 12km resolutions. These better represent local effects due to things like land elevation, coastlines and surface characteristics. These also have higher temporal variability, which means you can look at a projections not only for a specific day but time periods within that day.
- Marine Projections: these are new projections of time mean sea-level rise and extreme water levels for the UK coastline.
- Observations: a comprehensive set of observations of weather and climate covering the UK to give context, with some the records extending back more than 150 years.
You can delve further into these five areas here.
What are the main headlines in terms of what the data reveals about projected changes over the coming decades?
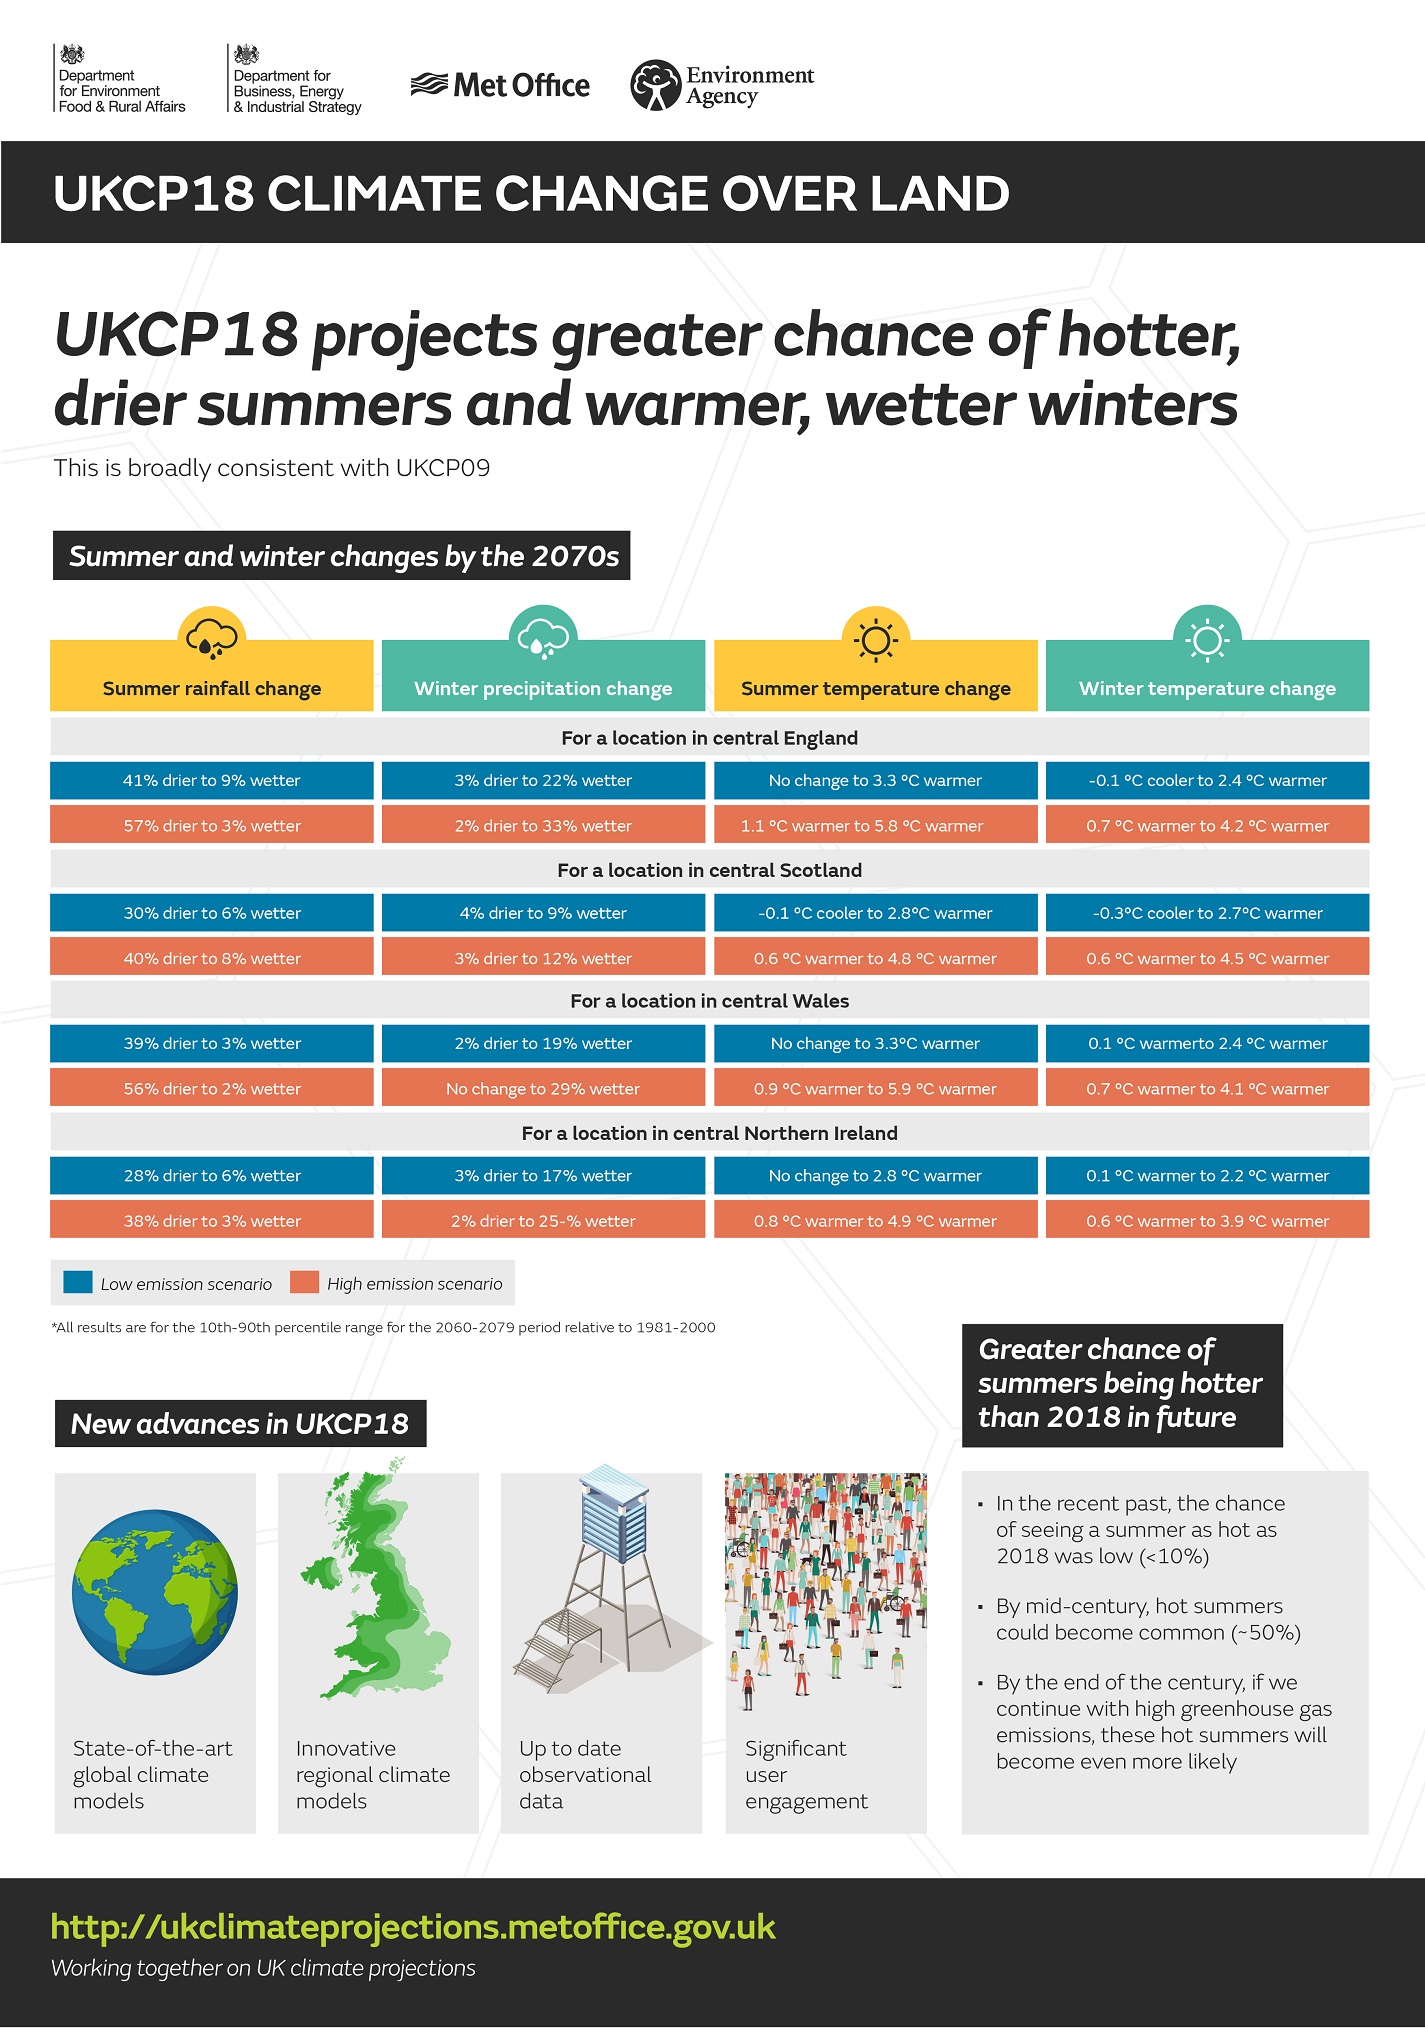
Broadly, the projections show increasing summer temperatures, more extreme weather and rising sea levels. All in all, they are a further demonstration that urgent international action is needed.
The high emission scenario shows:
- Summer temperatures could be up to 5.4 °C hotter by 2070, while winters could be up to 4.2 °C warmer
- The chance of a summer as hot as 2018 is around 50 % by 2050
- Sea levels in London could rise by up to 1.15 metres by 2100
- Average summer rainfall could decrease by up to 47 % by 2070, while there could be up to 35 % more precipitation in winter

How can organisations engage with and make use of this data?
The intention is that UKCP18 can be used as a tool to guide decision-making and boost resilience, creating an open resource so that organisations and practitioners can tap into all five areas of the climate data sets and use them alongside their own organisational data. The first step is to sign up to the User Interface, which gives access to a range of "products". These include:
- Maps and graphs, which can be tailored to show different regions/ emissions scenario
- UKCP data in comma-separated-values (CSV) format for those more familiar with handling large datasets
The idea is that users will be able to undertake impact assessments and test their adaptation plans against them.
To enable our members to make the best use of these products and the available data, we will be running a workshop with Met Office in the New Year that will cover how to make best use of the projections. Details of the event will be shared in due course, but please get in touch if you would like to be involved and if there are specific points or areas you would like us to cover in the workshop as you explore the projections.